Tableau is a powerful platform for business intelligence and analytics that helps users observe and understand data in various forms. It enables the creation of diverse graphs, plots, and charts without requiring any programming skills. In essence, it simplifies complex data analysis, making big data more manageable and small data more insightful and actionable.
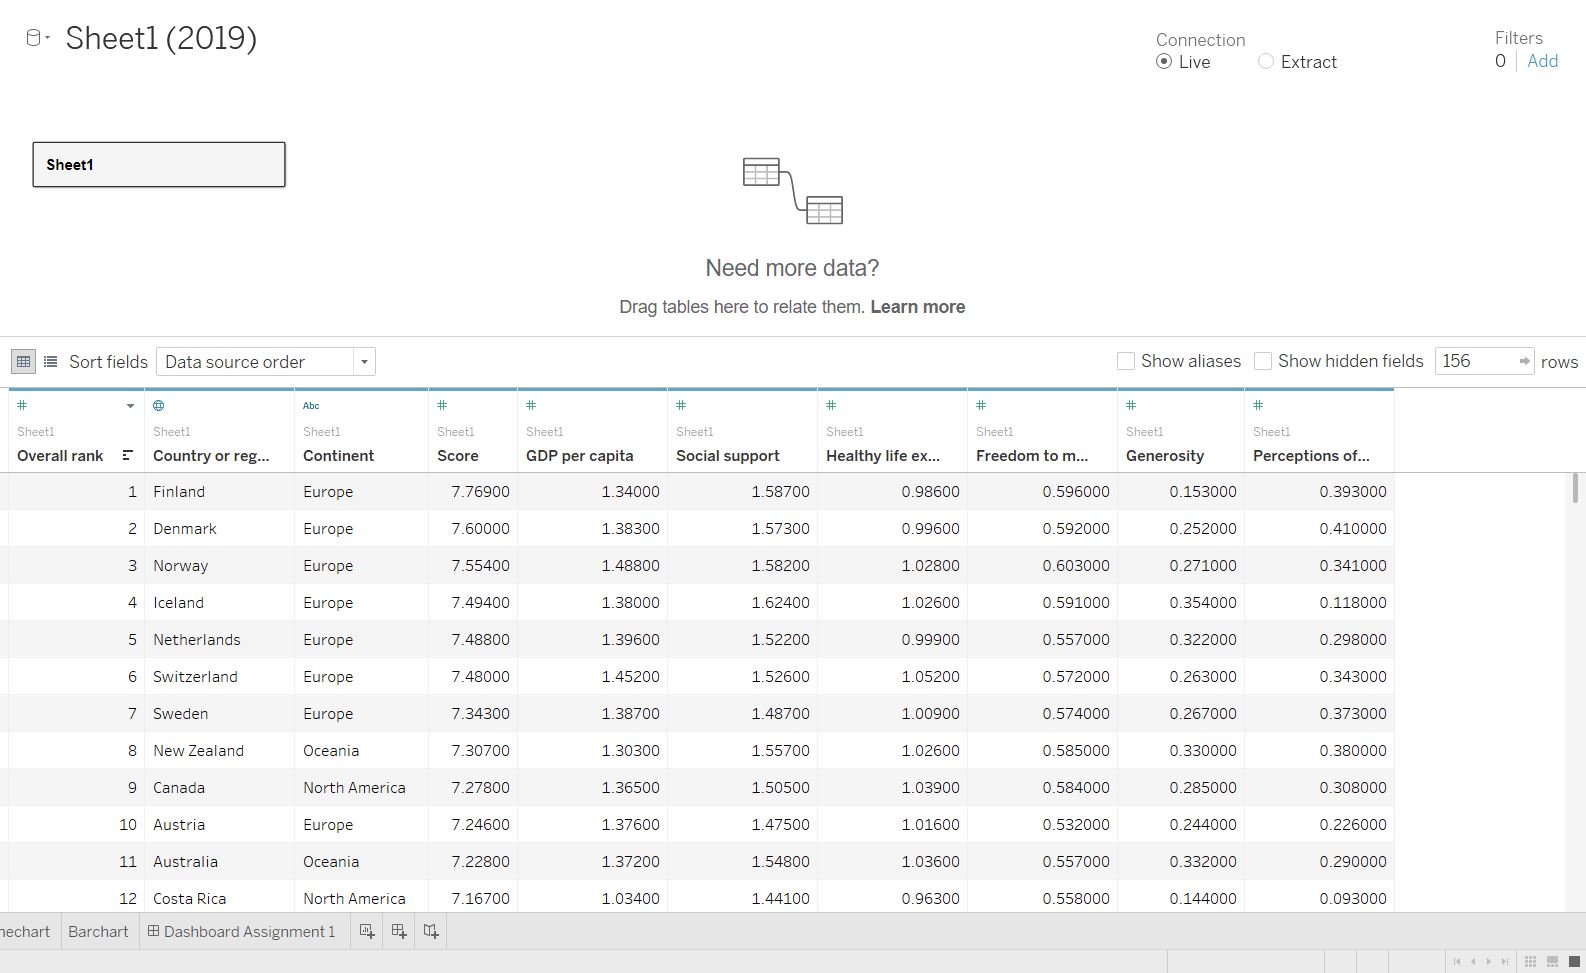
During the first semester of my Master’s degree, I took a Business Intelligence course where my coursemate and I completed assignments and projects involving data analysis using Tableau software. I found Tableau to be an incredibly helpful tool for understanding and analyzing data. The user-friendly interface makes the data analysis process seamless, even when dealing with multiple data sources or complex problems.
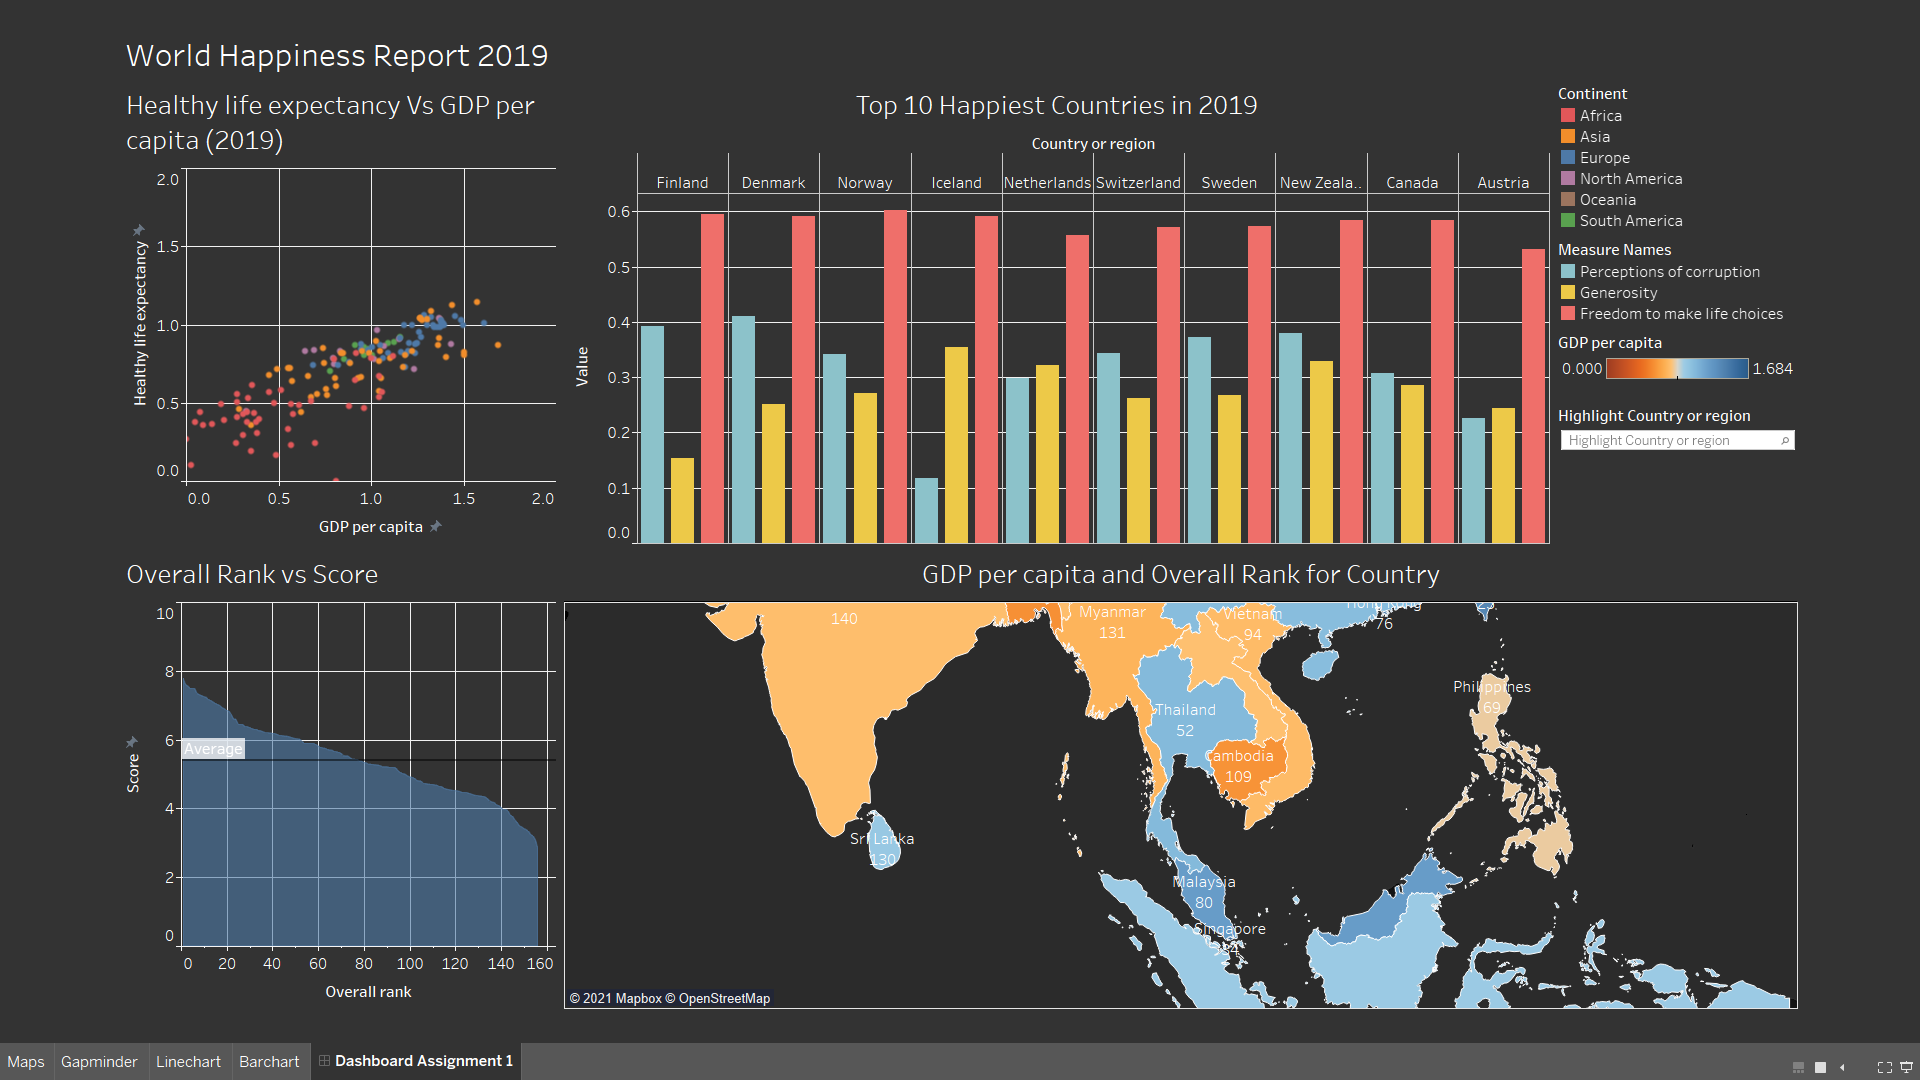
The user-interactive dashboard is one of Tableau’s standout features. It empowers users to visualize data comprehensively, gain deeper insights, and make informed decisions effortlessly.